


You can find the right UCITS ETF by starting from what you already know: an index, a US ETF you hold, or just your goals.
Then compare the funds that match on TER, tracking difference, fund size and share class, and check the ISIN before you buy.
Paasa's UCITS Screener lets Indian investors do all of this across more than 2,900 UCITS instruments, and this guide walks through each route, followed by a checklist to run before you buy.
New to UCITS? Start with what are UCITS ETFs.
Table of contents
- Why are global investors choosing UCITS ETFs?
- How do you find the right UCITS ETFs for global investment?
- How to check a UCITS ETF before you buy
Why are global investors choosing UCITS ETFs?
The main reason is the US estate tax, which for Indian residents applies above $60,000 of US holdings at rates up to 40%. Read how the US estate tax works for Indians and NRIs, or use our Estate Tax Calculator to find your exact liability.
Note: If you are a US tax resident (for example, a US citizen, a green card holder, or someone who meets the substantial presence test), UCITS ETFs are usually not right for you. The IRS treats most of them as Passive Foreign Investment Companies (PFICs), which leads to higher tax and complex yearly reporting. US citizens are also subject to US estate tax on their worldwide assets, so UCITS ETFs do not protect them from it. Read our guide on UCITS ETFs for NRIs: PFIC rules and US estate tax.
How do you find the right UCITS ETFs for global investment?
You can use Paasa's UCITS Screener to find, check and compare UCITS ETFs. It covers more than 2,900 UCITS instruments, and it is free to use.
The screener is built around five tools, Discover, Screen, X-Ray, Compare and Build, plus two lookup tabs that find the UCITS version of an index or of a US ETF. You can start with any of them.
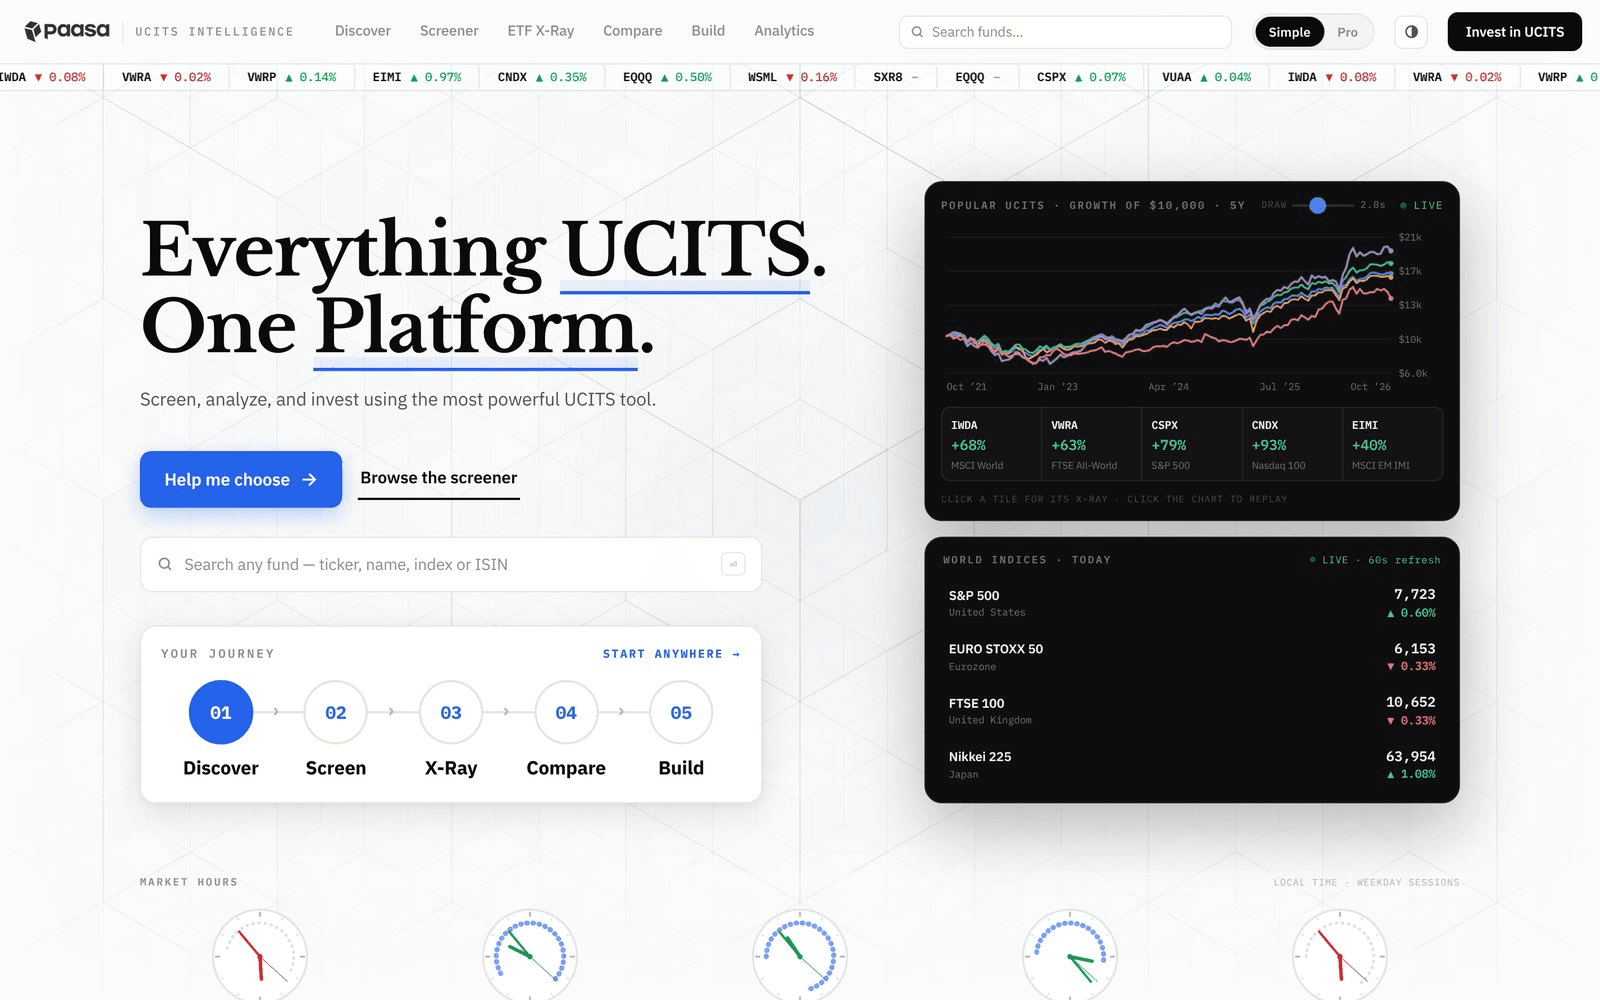
Discover: get a shortlist by answering questions
If you are not sure where to begin, click Help me choose. It asks you 11 short questions about your goal, risk, time horizon, asset class, region, income needs, currency, cost and ESG preferences.
Each answer turns into a filter, and the number of matching funds updates as you go. At the end, you get a shortlist you can open in the screener.
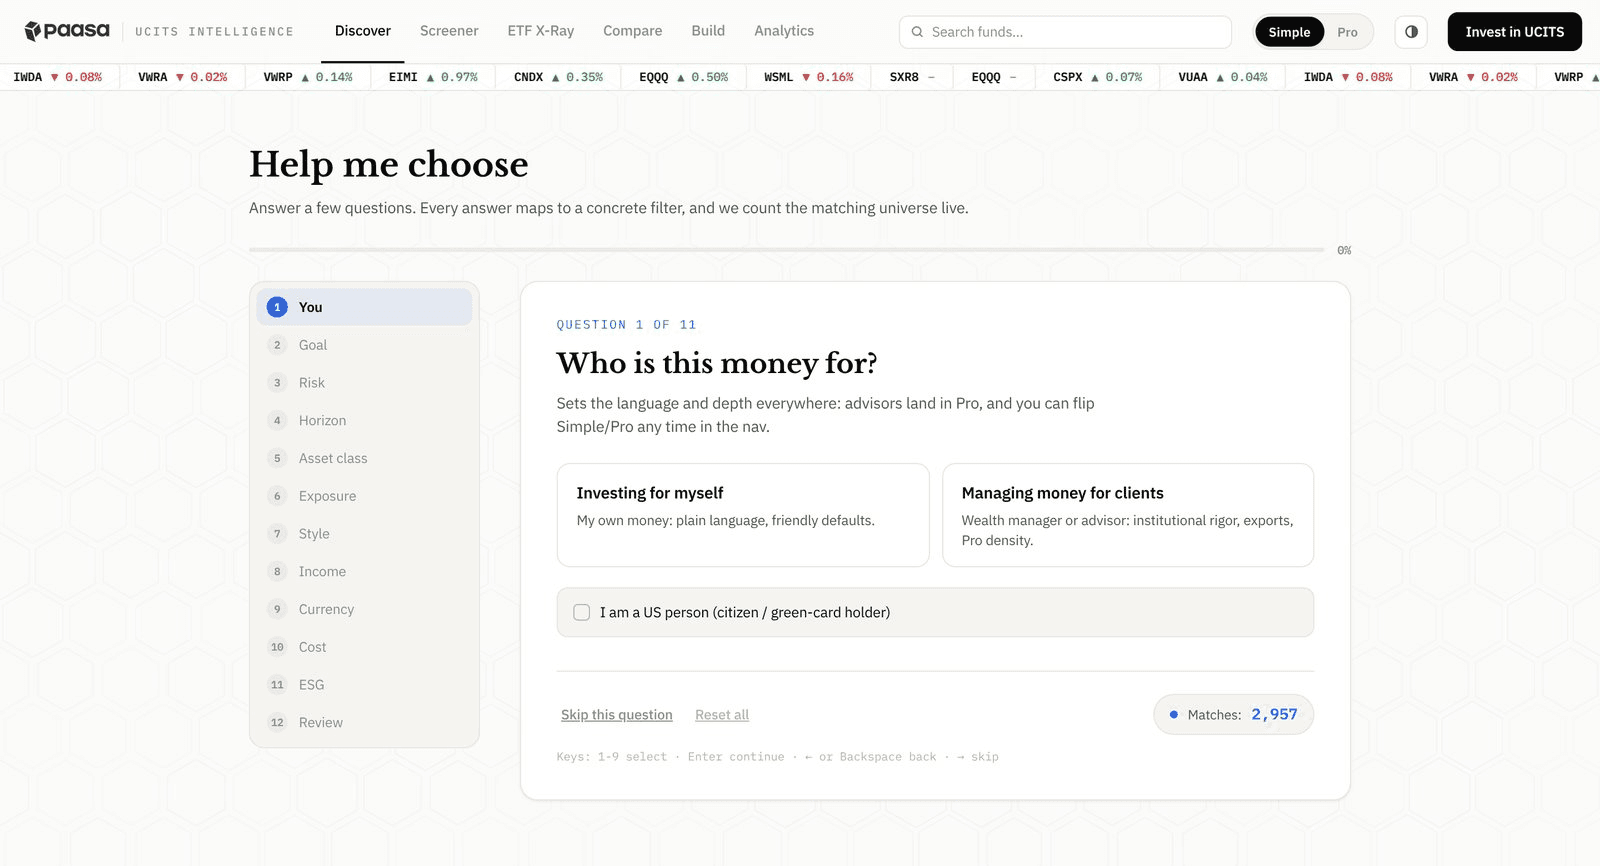
Note: The first question has a checkbox for US persons (US citizens and green card holders). UCITS ETFs are usually not a good fit for them, as explained above.
Screen: filter by what matters to a non-US investor
The Screener lets you filter the full UCITS universe. You can start with a ready-made preset, such as Cheapest S&P 500, Global equity core, Dividend income or EM core, or build your own filters.
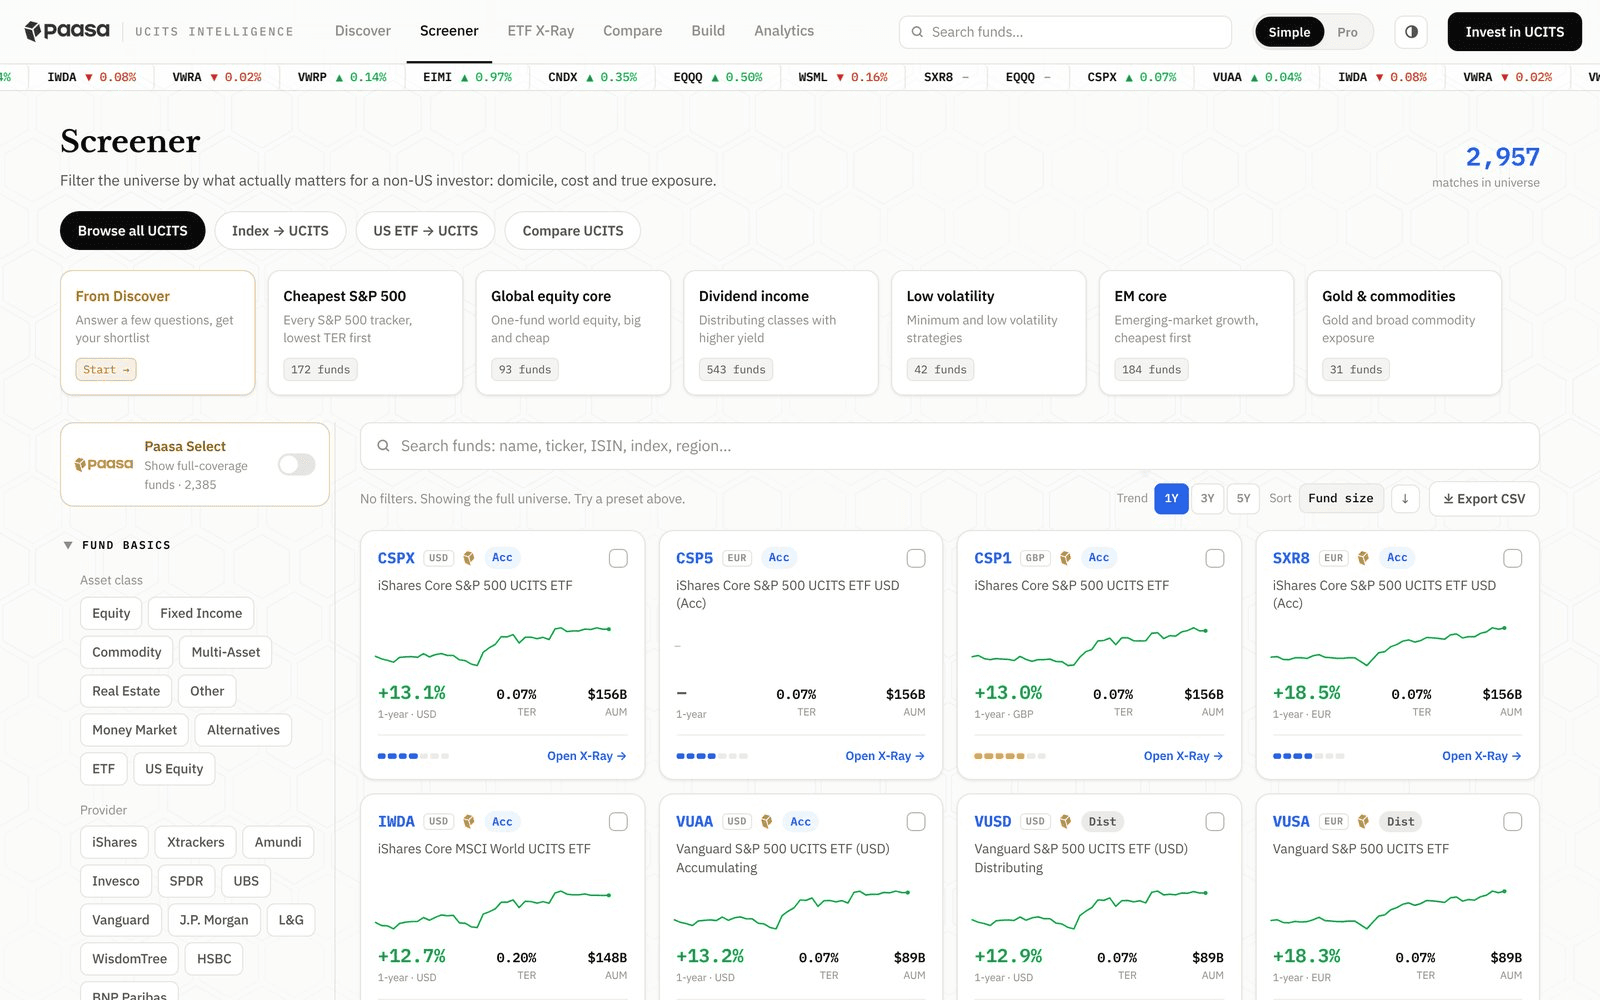
The filters are grouped as follows:
- Fund basics: Asset class (equity, fixed income, commodity, real estate and more) and provider (iShares, Vanguard, Invesco, SPDR, Xtrackers, Amundi and others).
- Cost: Maximum expense ratio (TER) and minimum fund size (AUM).
- Holdings and exposure: Where the fund invests, such as global, US, Europe, emerging markets, Japan or India.
- Structure: Domicile (Ireland, Luxembourg and others), replication (physical or synthetic), currency hedging, the exchange it is listed on, and its trading currency.
- Performance, risk, income and ESG: Return, volatility, dividend type and ESG screens.
Each fund card shows the ticker, trading currency, whether it is accumulating or distributing, its 1-year return, TER and fund size. You can sort results by fund size, TER, return, yield or risk, and export them as a CSV file.
Find the UCITS version of an index
If you already know the index you want, open the Index → UCITS tab. Pick an index, such as the S&P 500, MSCI World or Nasdaq 100, and you see every UCITS ETF that tracks it, ranked by cost.
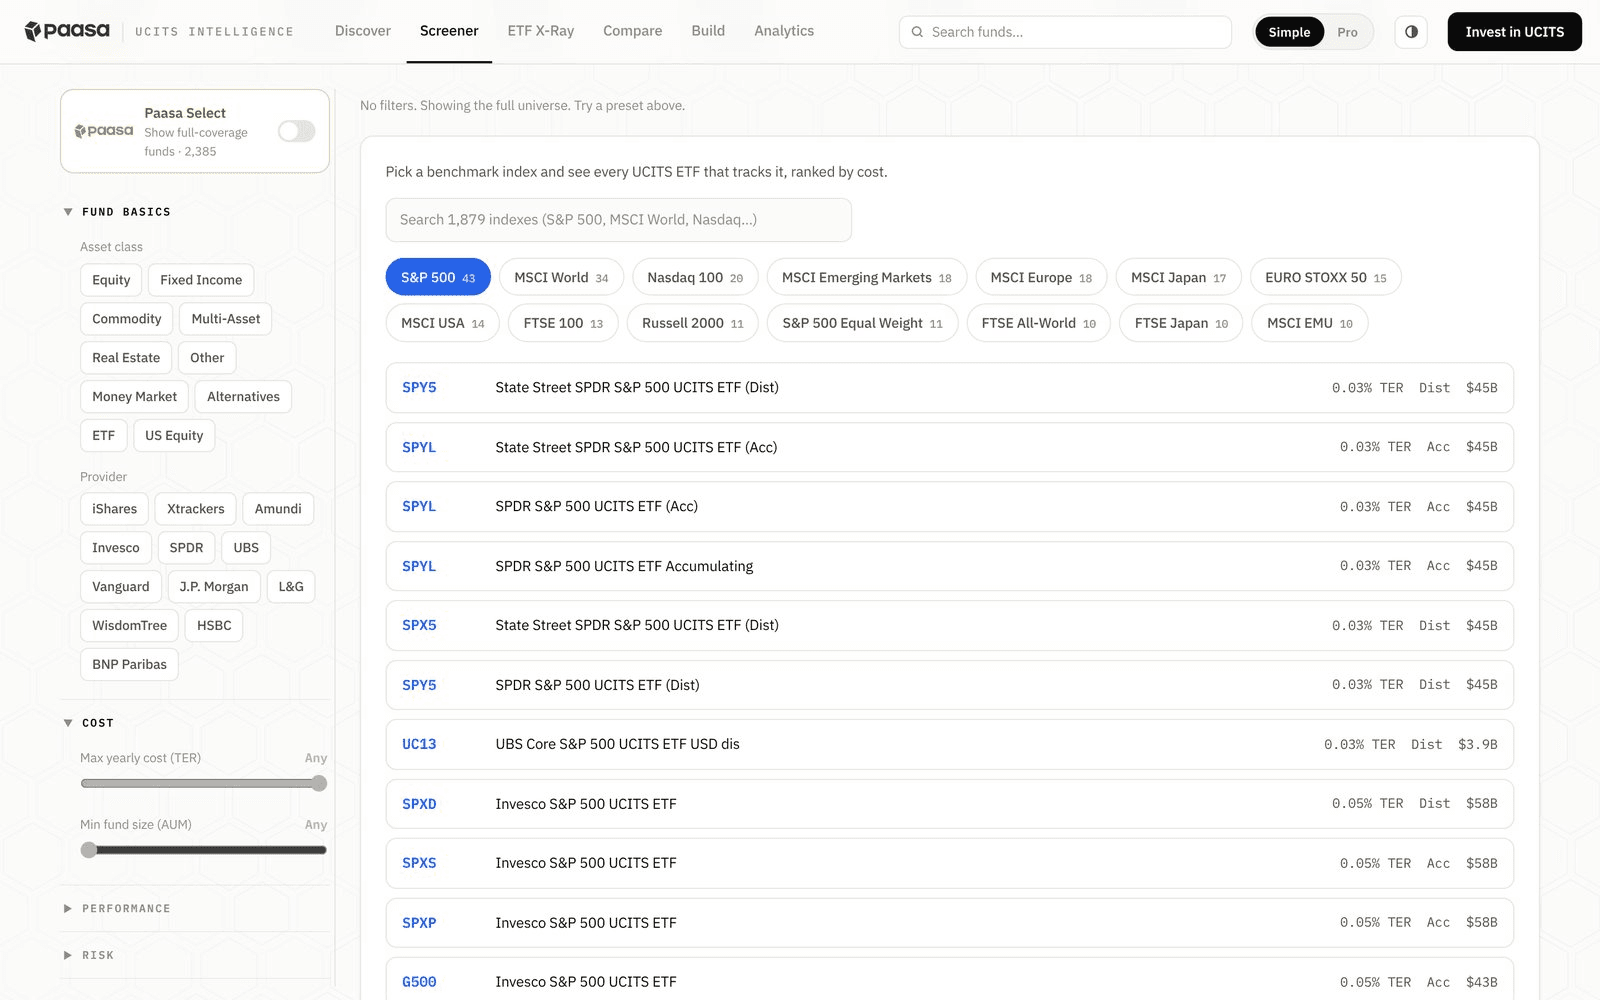
For the S&P 500, the tool lists 43 UCITS ETF lines, with TERs starting at 0.03%. A fund can appear more than once here, because each share class and listing is its own line.
Find the UCITS equivalent of a US ETF
If you already invest in a US-listed ETF, open the US ETF → UCITS tab and type its ticker, such as SPY, VOO, QQQ or VTI. The tool shows the UCITS funds that track the same index, ranked by fit and cost.
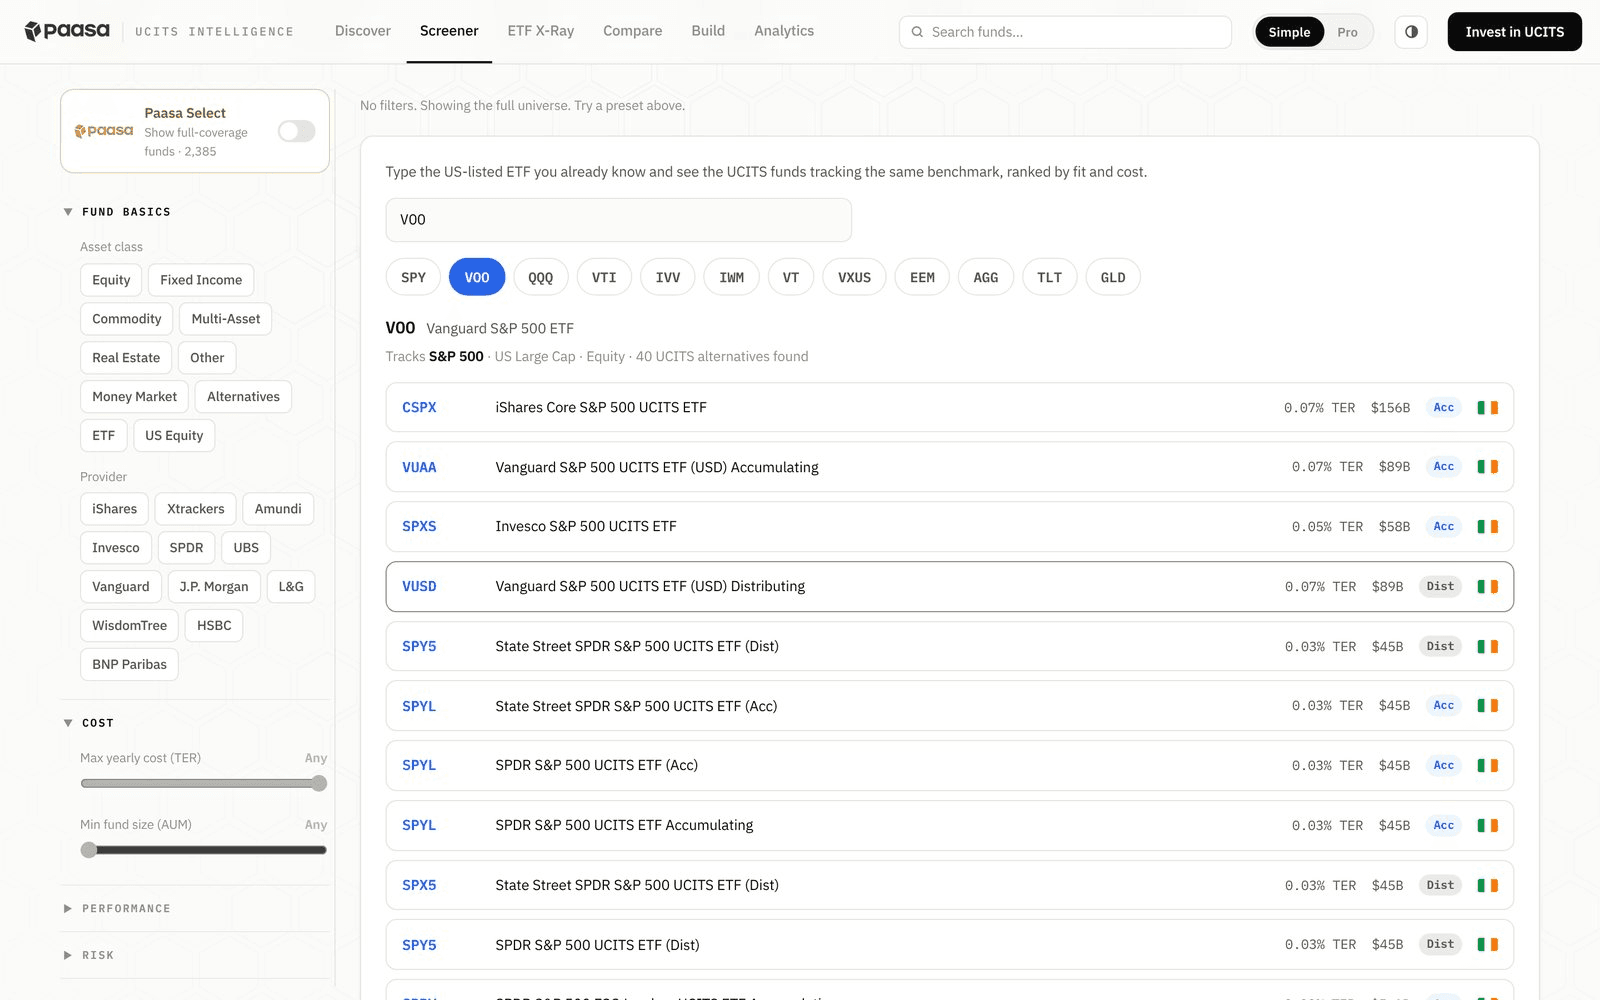
Example. Suppose you hold VOO (Vanguard S&P 500 ETF) and want the same exposure without the US estate tax risk. Type VOO, and the tool lists the UCITS ETFs that track the S&P 500, led by three accumulating lines that trade on the LSE in USD: CSPX (iShares), VUAA (Vanguard) and SPXS (Invesco). Each result shows its TER, fund size, share class and domicile.
X-Ray: look inside any fund
Click any fund to open its X-Ray. The top of the page shows the details you need to identify the fund: its ISIN, domicile, index, trading currency, share class, exchange and the US dividend withholding tax rate it pays.
Below that are its TER (with the yearly cost on $10,000), fund size, 1-year and 5-year returns, volatility and risk band.
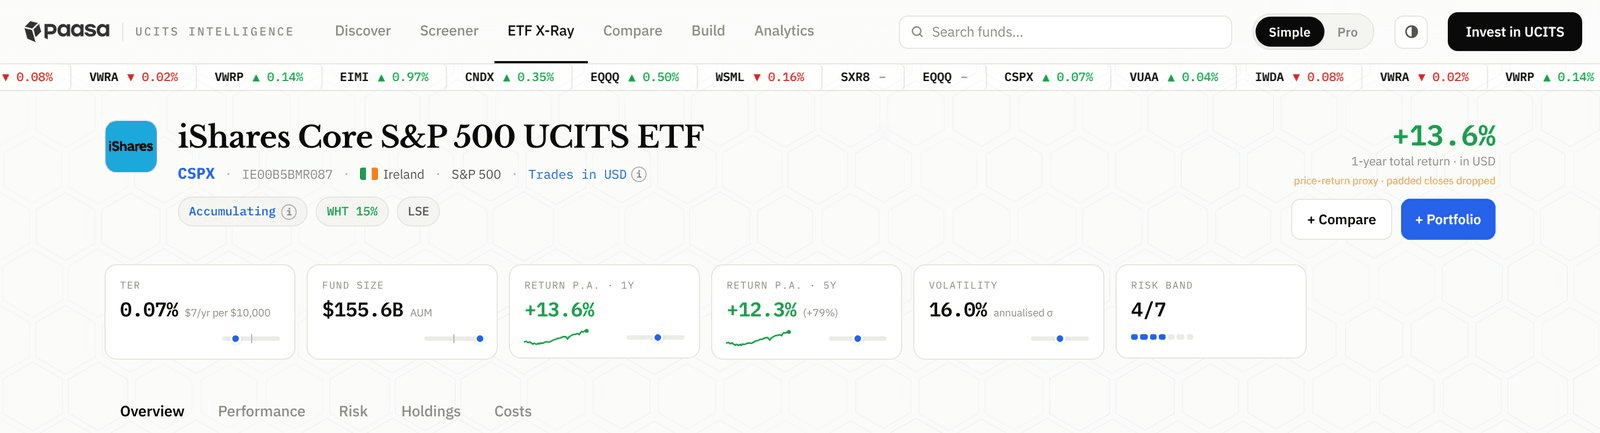
The X-Ray has five tabs:
- Overview: Growth of $10,000 against the fund's index (in USD or INR), a plain-language summary, key facts, other listings of the same fund on different exchanges and currencies, and similar funds that track the same index.
- Performance: Returns over different periods.
- Risk: Volatility and other risk measures.
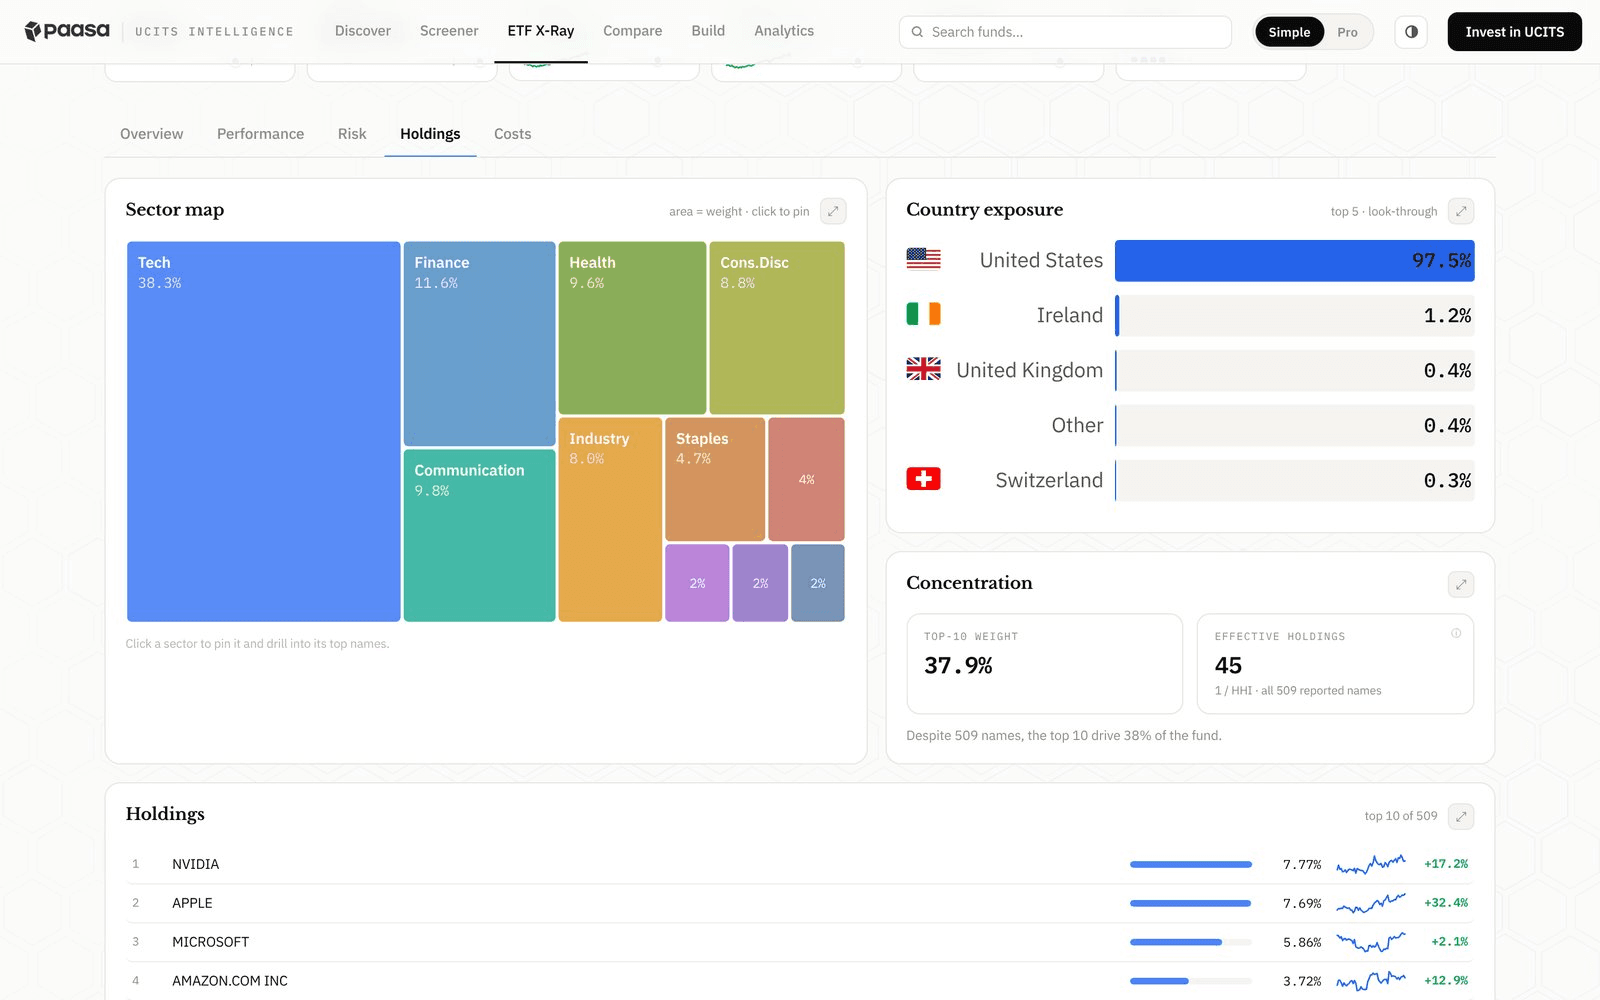
- Holdings: A sector map, country exposure, concentration in the top 10 holdings, and the largest holdings.
- Costs: The headline TER next to the fund's realised tracking difference (see tracking difference vs tracking error below), plus what its domicile means for withholding tax.
Compare: put funds side by side
The Compare page shows up to four funds side by side at the ISIN level. The best value in each row is highlighted. You can select funds from the screener or add them by ticker, name or ISIN.
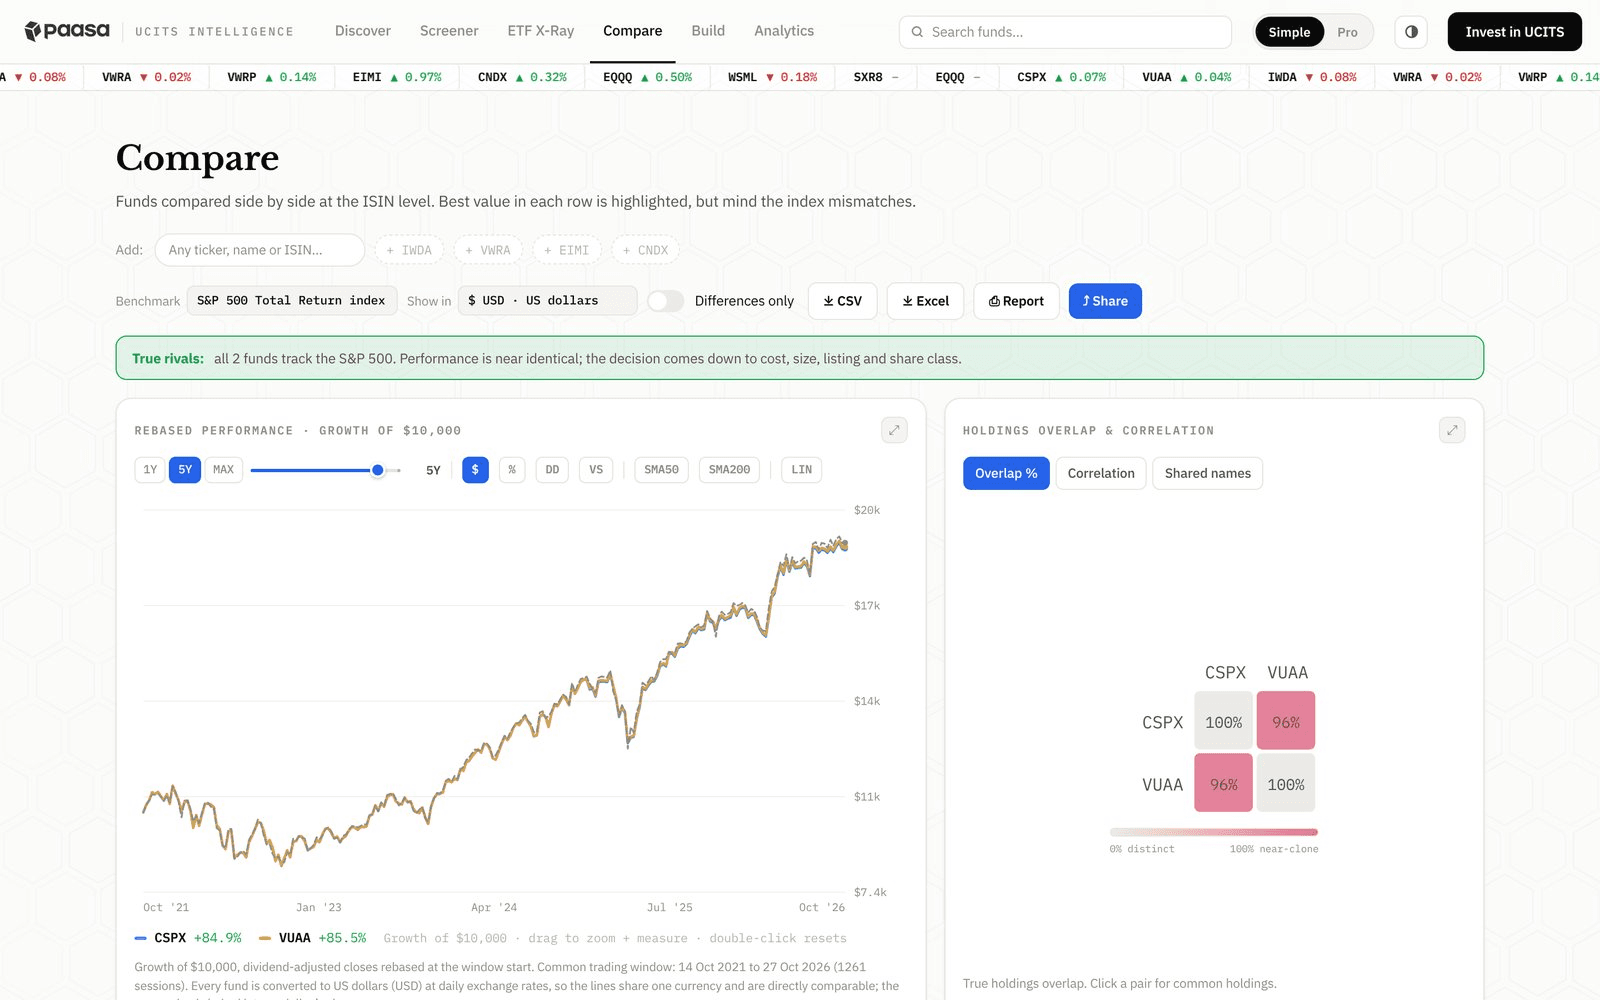
The comparison includes:
- Rebased performance: Growth of $10,000 for each fund, converted to one currency (USD, INR, EUR, GBP, CHF or JPY) so the lines are directly comparable.
- Holdings overlap and correlation: How much of each fund's holdings the other fund also holds, and how closely their returns have moved together. CSPX and VUAA, for example, show a 96% holdings overlap in the tool.
- Row-by-row details: Identity and structure, cost, performance, risk, income, and liquidity and size.
When all the funds track the same index, the page tells you so. In that case performance will be nearly identical, and the choice comes down to cost, fund size, listing and share class. You can turn on Differences only to hide matching rows, and export the comparison as a CSV, Excel file or report.
Build and analyse a portfolio
The Portfolio Builder lets you combine up to 10 funds and a cash allocation. You can set weights manually, equally or by inverse volatility.
As you change the weights, it recalculates the portfolio's historical return, volatility, Sharpe ratio, maximum drawdown, beta and a diversification score. It also shows how much of the portfolio's return and risk comes from each fund.
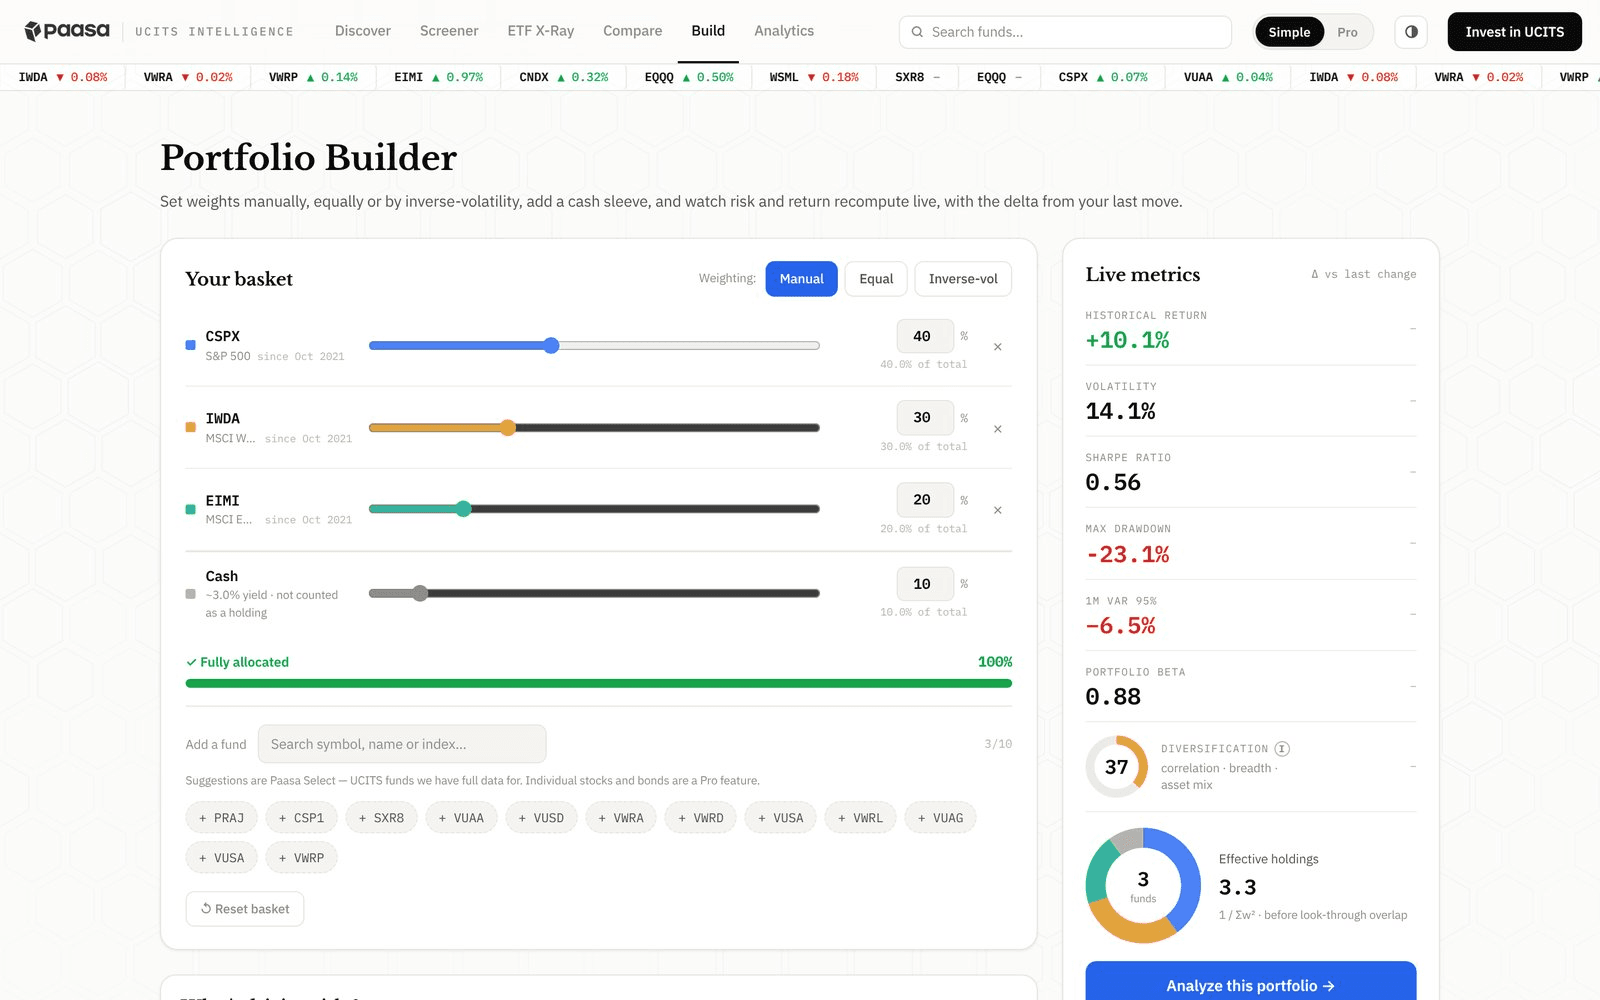
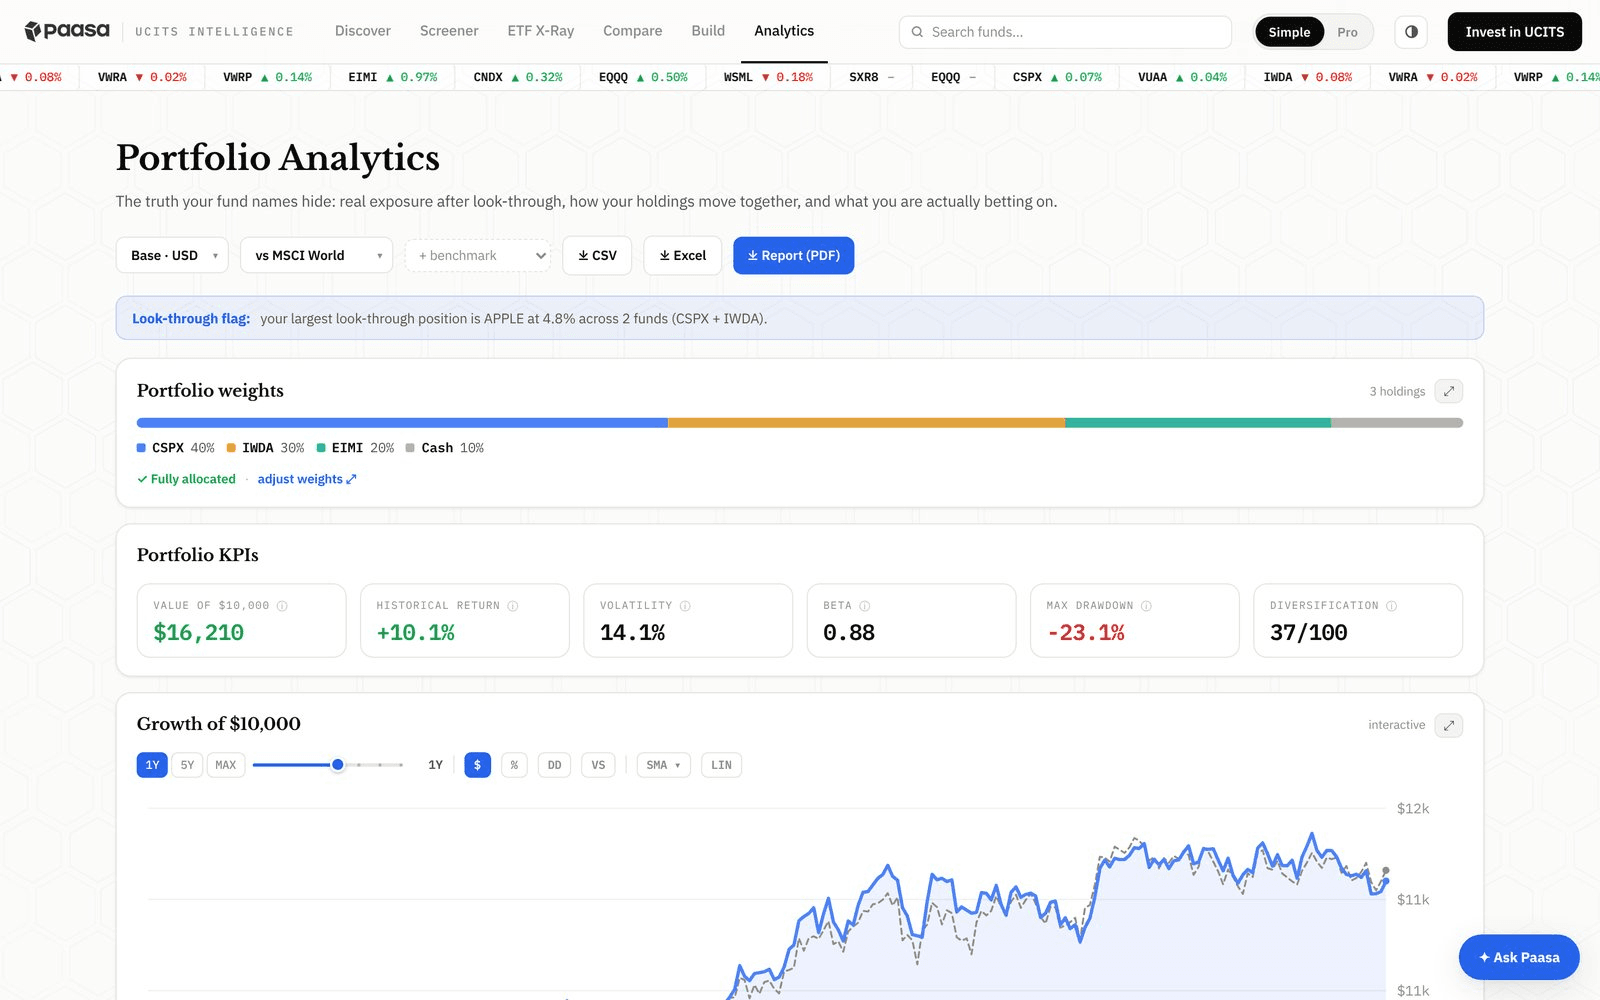
Click Analyze this portfolio to open Portfolio Analytics. It looks through your funds to show your real exposure, and it flags stocks that appear in more than one fund. For example, a portfolio of CSPX and IWDA holds Apple through both funds.
You can compare the portfolio against a benchmark such as MSCI World, and download it as a CSV, Excel file or PDF report.
Note: The screener has a Simple mode with plain-language explanations and a Pro mode with more data. You can switch between them from the top bar at any time.
Want a ready-made shortlist instead? See top UCITS ETFs for Indian investors, which lists funds by index.
How to check a UCITS ETF before you buy
The screener helps you shortlist funds, and its X-Ray shows most of the checks below in one place. Before you buy a fund, check it in this order:
- ISIN: The first two letters show where the fund is domiciled (IE for Ireland, LU for Luxembourg). Also check that the ISIN matches the share class you want, accumulating or distributing, since each has its own ISIN.
- Factsheet: Check the expense ratio (TER), fund size, replication method (physical or synthetic), dividend policy, and tracking difference.
- Key Information Document (KID): A short summary of the fund's risk level, costs, and regulator.
- Prospectus: The full rulebook for the fund. You only need it if something in the factsheet or KID is unclear, such as how the fund uses swaps or lends its securities.
- Annual report: Shows what the fund actually held and what it actually cost over the year.
- Exchange listing: Check the ticker, trading currency, and bid-ask spread on the exchange you will buy on. The spread is the gap between the buying and selling price, as a share of the price: (ask price minus bid price) divided by the midpoint price. Spreads are usually tightest when both the European and US markets are open, from about 2:30 pm to 4:30 pm UK time. The X-Ray lists every listing of a fund under "Listings of this fund".
Tracking difference vs tracking error
Factsheets show two numbers that sound alike but measure different things:
- Tracking difference: How much the fund's return differs from its index over a period. If the index returns 10% and the fund returns 9.9%, the tracking difference is minus 0.1%. This is what holding the fund actually costs you.
- Tracking error: How much that difference moves around over time. A low tracking error means the fund follows its index consistently.
When comparing two funds on the same index, tracking difference matters more. See tracking difference vs TER for how the two relate.
Fund size and closure risk
Fund providers can close or merge funds that do not attract enough money. If your fund closes, you receive its value in cash. In India, that counts as a sale, so you may owe capital gains tax and will need to reinvest. Read what happens if a UCITS fund closes.
Larger, older funds are less likely to close. Many investors prefer funds with at least €100 million in assets and a few years of history.
Red flags to watch for
- Luxembourg domicile for a fund that holds US stocks directly: It usually pays 30% US tax on dividends, compared with 15% for an Irish fund (see Ireland vs Luxembourg UCITS). Synthetic funds that track US indices through swaps are an exception, since they generally do not pay this tax.
- Distributing share class for long-term growth: For Indian residents, dividends paid out are taxed every year. Read more on accumulating vs distributing UCITS ETFs.
- Small or new fund: Less than about €100 million in assets, or less than a few years of history.
- Poor tracking difference: The fund trails its index by much more than its TER, or by more than similar funds.
- Wide bid-ask spread: You lose more each time you buy or sell.
- Higher TER than similar funds: Another fund may track the same index for less.
Related: What are UCITS ETFs? and Top UCITS ETFs for Indian investors
About Paasa
Paasa is a global investing platform for Indian residents and NRIs. It gives you direct access to stocks, ETFs and UCITS funds on their home exchanges across the US, Canada, the UK, Germany, France, Switzerland, the Netherlands, South Korea, Japan, Hong Kong and Singapore.
- UCITS access: Buy UCITS ETFs and UCITS mutual funds in USD, GBP or EUR lines from one account.
- LRS and FEMA handled: The remittance paperwork is prepared for you, and every INR transfer is tracked for your return.
- Tax reports: Schedule FA, capital gains and dividend reports built for Indian tax returns, included with the account.
Start investing in UCITS ETFs with Paasa
Free tools: Estate Tax Calculator and Brokerage Calculator.

